Twitter recently announced a series of changes in its strategy that will affect companies that use this platform to get closer to their customers. The most relevant announcement was the statement made by the company’s CFO, Anthony Noto, saying that in 2015 the social network will use a new algorithm that will affect the way in which tweets appear in the timeline.
This means that from next year the tweets in our timeline will not appear in reverse chronological order, as they do now. Instead, we will see tweets selected because of their relevance, which may be the favorites of other users and/or popular tweets of users who we don’t follow. According to the expert Cesar Calderón, this means that “in your timeline, instead of seeing all the posts from people or brands you follow, you will only see what the new algorithm considers relevant, which in practice will reduce the impact and virality of your publications in a significant way.”
Twitter believes that showing tweets based on the time of posting “is not the most relevant user experience. Therefore, the solution is an algorithm showing the depth and breadth of the content published about a specific topic, and then relate it with people,” according to Noto.
This new strategy is generating a lot of uncertainty among users, as the company has not provided much information about the actual implementation of the new algorithm. The speculation about how it will affect businesses is very high. On the one hand, the new strategy could serve as a motivation to follow new accounts that the user otherwise would not find. But on the other hand, it could affect the real-time marketing that in recent years has been gaining popularity; this algorithm may mean that brands will probably have to pay to see their tweets distributed in real time to a certain number of people.
The advantages of having Twitter Analytics
Despite the changes that may be coming, one of the best ways to not diminish your strategy on Twitter is to focus on listening and understanding your followers. Users can help you define the role of your brand in the social network when you understand if they follow you to keep updated about news, or to have a direct channel to communicate problems, complaints, etc.
In this sense, Twitter has taken a big step making available to all users its data analysis tool: Twitter Analytics. This provides any startup or self-employed the opportunity to take full advantage of all the data a tweet can generate, being able to evaluate, for example, how they can impact better on the target audience and/or how we are winning or losing followers.
To do this, Twitter offers in the main page of Analytics a panel in which at first glance we can see two interesting statistics: impressions and interactions. Impressions refers to the number of times users saw a tweet in your timeline. Interactions indicates the total number of times a user has interacted with a tweet; this includes clicks anywhere in the tweet, including labels, links, avatar, username and expansion of the tweet, besides retweets, replies, follows and bookmarks. To all this Twitter adds the interaction rate, which is the number of interactions (clicks, retweets, replies, follows and favorites), divided by the total number of impressions.
As you can see, with all these data you have enough information to create different graphics to easily analyze your Twitter’s account history (every 28 days), allowing you to make monthly comparisons.

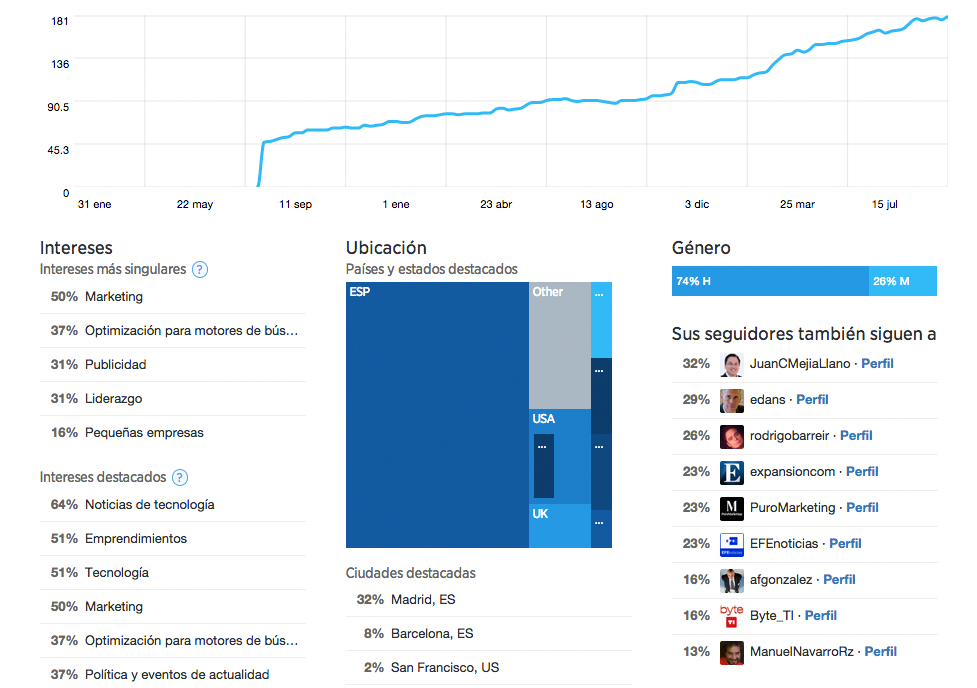
Twitter Analytics also includes a “Followers” tab, where you can see a graph showing the evolution of the number of people who follow and unfollow your account. Although perhaps something more interesting is that you can also see detailed data about your followers, such as location, gender, related accounts and something very important at the business level: their interests. This information is very relevant when it comes to think strategically about the content of a tweet, allowing you to be more in line with the preferences of the target audience.
Twitter Analytics offers the possibility to export or download its data to a CSV document, which can be opened with Excel and customized in order to present a good statistics report.
Finally, if you have hired Twitter’s ads services, you will have access in the “Promoted” tab to information about the impressions and interaction of your promoted tweets. However, either if you use the free tool or you pay, content continues to be crucial. This is why it is very important to keep focused in the generation of interactions, and not just exposure.
An example of the strategic use of Twitter Analytics can be found in California based startup Enplug, whose digital displays business has provided great benefits. In Spain, Desigual clothing store used the promoted accounts and promoted tweets


