Get the maximum benefit from data with these four tutorials
Mapping data, visualizing them in geospatial apps and applying automatic learning. We put our knowledge into practice with the help of these video tutorials.

Mapping data, visualizing them in geospatial apps and applying automatic learning. We put our knowledge into practice with the help of these video tutorials.

If you missed the InnovaChallenge Data Week event, there's nothing to worry about. Here are all the presentation so you can go through everything that the experts panel dealt with.

Tableau has become one of the most widely used tools among data analysts in both the corporate and business world and among professionals who use it for editorial purposes.

Dare2Data is one of the pillars of InnovaChallenge Data Week. This intensive course gathered experts from all areas dealing with information: analysis, visualization, prediction…

Data analysis tools, visualization tools, advice for achieving a good return on investment in Big Data projects… All is revealed our Dare2Data experts' presentations.

Graph databases help to find relationships between data and extract their true value. One of the best known is Neo4j, which is a service implemented in Java.

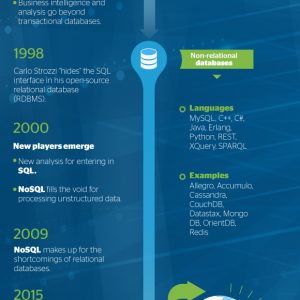
Databases are indispensable when developing a website or app. They are a vital for storing and correlating content and give meaning to all structures built.

All companies have so many easy-to-use data analysis solutions at their disposal, that it would be a sin not knowing what will happen in six months

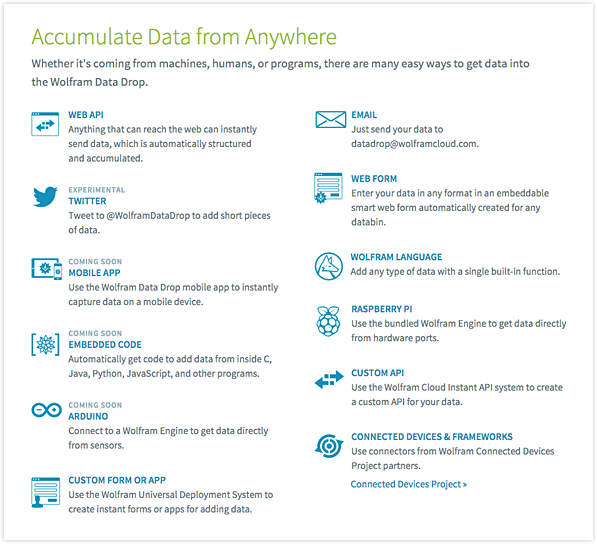
The Internet of Things has long pursued the idea of a world of devices fully interconnected through the Internet. Wolfram Data Drop, the scientist Stephen Wolfram’s latest project, might be the solution.

Keeping track of these operations is an excellent thermometer to know what, how and why a particular sector is an opportunity for software developers.