Whenever Tableau releases a new version, even in testing, the large community around this tool that displays complex data makes the promotion rattle reverberate. There’s no better marketing possible than having an eager, active community in social networks that is enthusiastic about promoting a product that, in many cases, has become a profession. Tableau 10 is the latest version of a highly-valued tool.
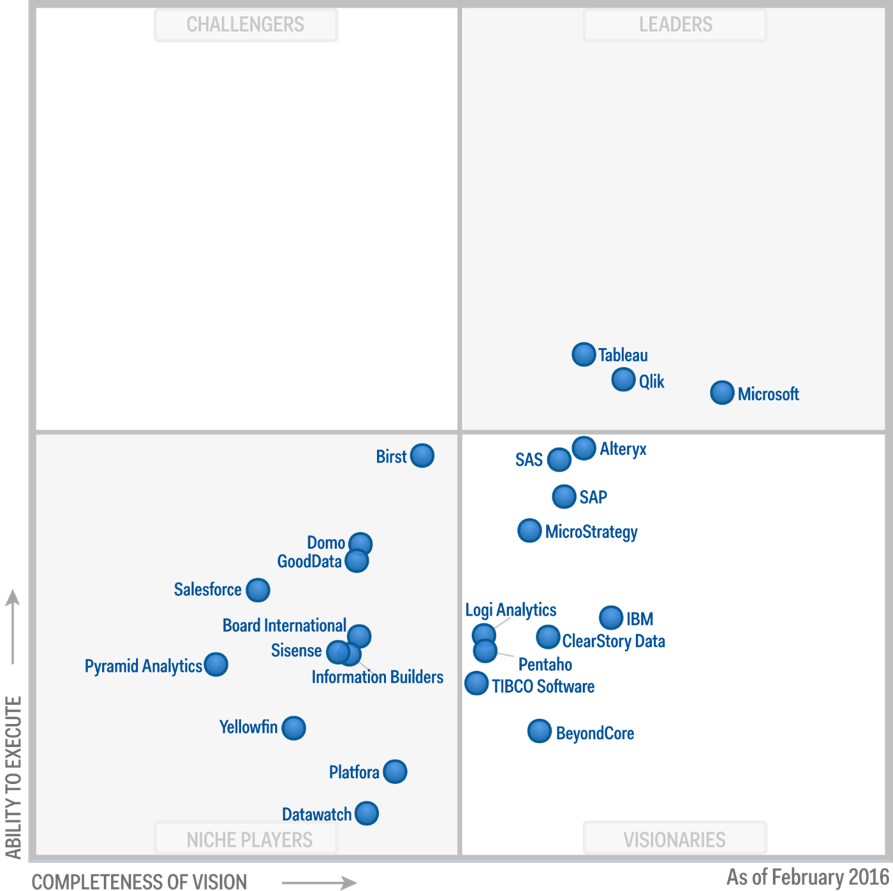
Not only is it well regarded by its users, whether journalists or analysts, and well promoted by those known as Tableau Zen Masters, but many of the consultants in many parts of the world issue very positive reports on Tableau compared with other business intelligence tools. Gartner annually publishes a quadrant with industry leaders, a report they call the ‘Magic Quadrant for Business Intelligence Platforms and Analytics’, that in February 2016 again placed Tableau among the best options in the market with Microsoft solutions, Qlik and Alteryx.
The result of its huge success is the almost constant evolution of the tool itself. It rarely ignores requests from the community, is really involved in improving the platform, and always implements improvements that generate value and perpetuate use by users, of both the paid and free version (in this case known as Tableau Public).
With Tableau 9 we already carried out a review of the five most important developments of that edition, and this time we will do the same with version 10, which includes some interesting questions for its users:
1. Responsive Tableau for Android mobile devices
If there was a request from Tableau users, that was without a doubt the simple adaptation of panels to mobile devices. Tableau had become a dashboard tool that was quite useful for viewing on desktops, but when those consultations used it on mobile phones the user experience was quite negative.
Today it’s difficult to compete in the market using unresponsive tools that greatly impair the end user experience, an element that already has negative consequences for major search engines like Google.
Much of the effort that Google has put into adapting websites to mobile devices is what served it as a spur for the launch of its AMP, Accelerated Mobile Pages, project, which is the new fast-loading news format that appears among the top organic search results.
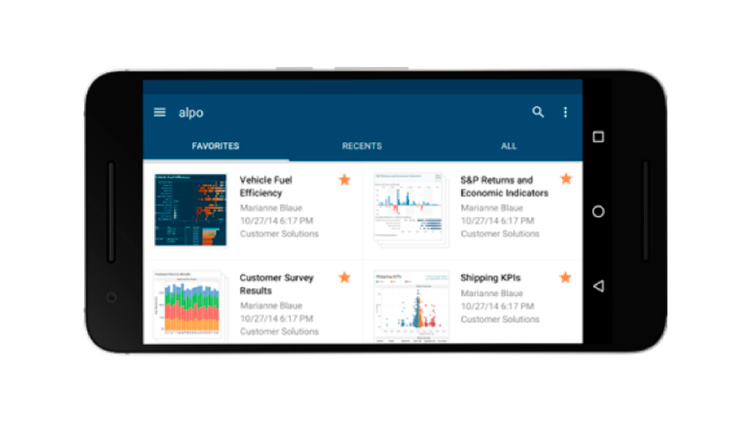
For now Tableau allows a responsive adaptation of dashboards for mobile devices using the Android operating system (Google). With this version users can share their data visualizations on any type of screen as it customizes and publishes business intelligence pictures optimized for desktops, tablets or mobile phones.
2. Version control in workbooks
Tableau 10 has added a new functionality that can be really useful when handling large volumes of data. It is similar to any version control system, such as those that can use content management systems (CMS). Today, any user of Tableau 10 can revert to a previous version of their workbooks through the Tableau Server. In version 9.3, users had to download all data from a previous version and publish again to return to the previous position. With version 10, workbooks can be restored directly, without having to download and publish the data again. A breakthrough that facilitates use.
In addition, users of Tableau 10 have the advantage that before restoring a previous version of their dashboard, they have the option to choose to preview the exact version they want to publish. In this workflow, the user can even open multiple previous versions simultaneously in different tabs. Tableau offers the option for users to be able to limit the number of reviews allowed per book from the actual Tableau Server setting.
3. Improvements in the JavaScript API
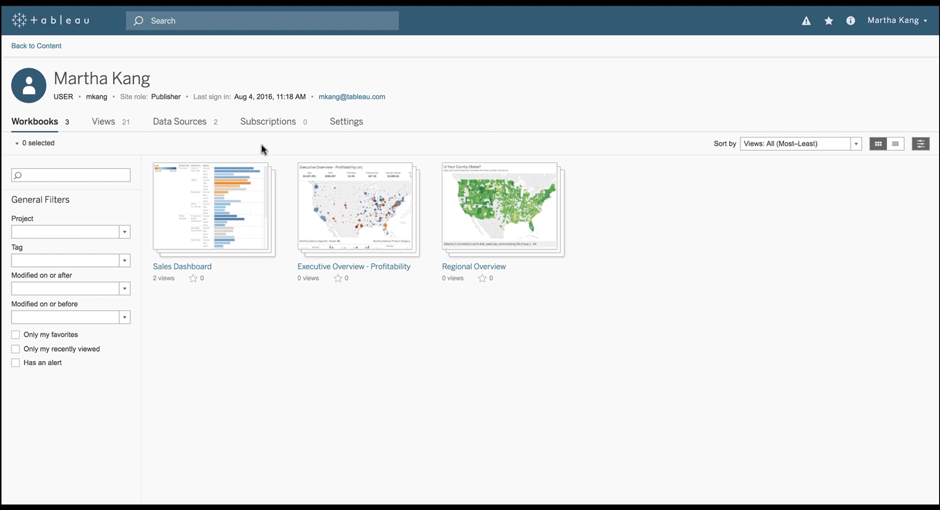
Tableau has decided to introduce an improvement in the JavaScript REST API, an essential move if it wants to extend its tentacles and offer all kinds of opportunities to users and developers who want to integrate with other Tableau services. In addition, the application user interface itself has improvements in the calls that you can make to the API to obtain data for viewing. Specifically, one of the most important advances is the ability to filter and sort.
To remove a particular piece of data in earlier versions of Tableau, it was necessary to make a GET request to the REST API and iterate with each and every one of those data to find a needle in a haystack. Now that workflow is behind us. The final search process is automated: first a GET request is made to the REST API and then a filter is applied to find the data, without going one by one. The filter in question would be something like this, with the idea of obtaining information from a user named, for example, Juan: /users?filter=name:eq:juan.
In addition, users with technical knowledge can work with Tableau files (.twb and .tds) and deploy them on different servers and databases.
4. Filter simultaneously in multiple datasets
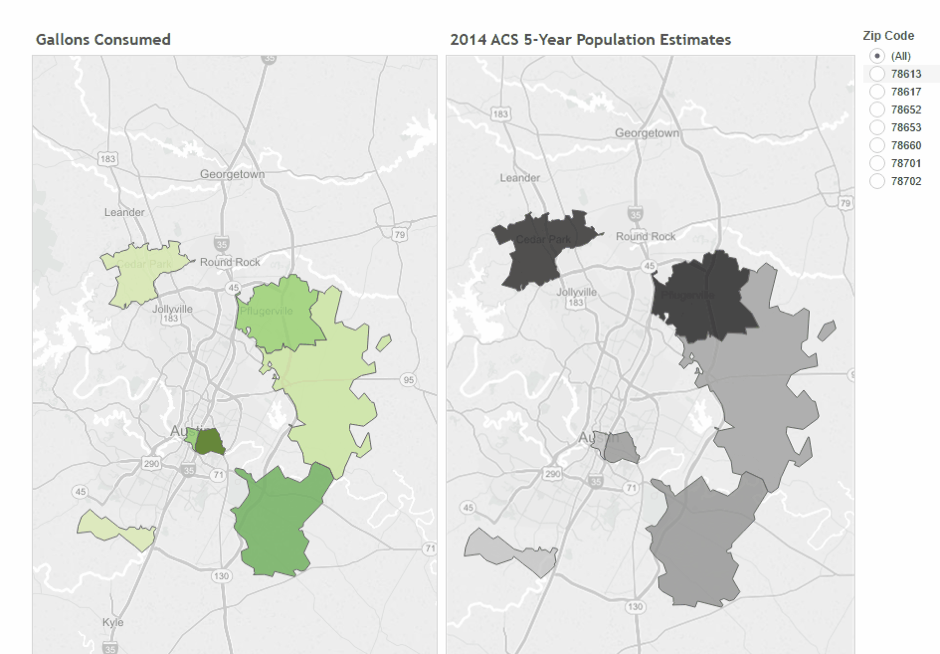
This feature seems silly, but when you’re doing data visualizations, having the ability to use a single filter for two different graphics with two different data tables can be wonderful. Only condition in Tableau 10: the field you want to filter on both visualizations must be called the same in both data tables. A logical condition.
A practical example would be to have two maps with two different tables with data on different ‘gender’, ‘age’ and ‘income’ but with an identical field that is ‘zip code’. With this new Tableau 10 functionality a filter could be created through which to access different data from both maps through the zip codes selection. Here is a more leisurely explanation.
5. Extra point on new developments in Tableau 10
The above four points do not summarize all the new features that Tableau has decided to incorporate into its newly-released version. There are more:
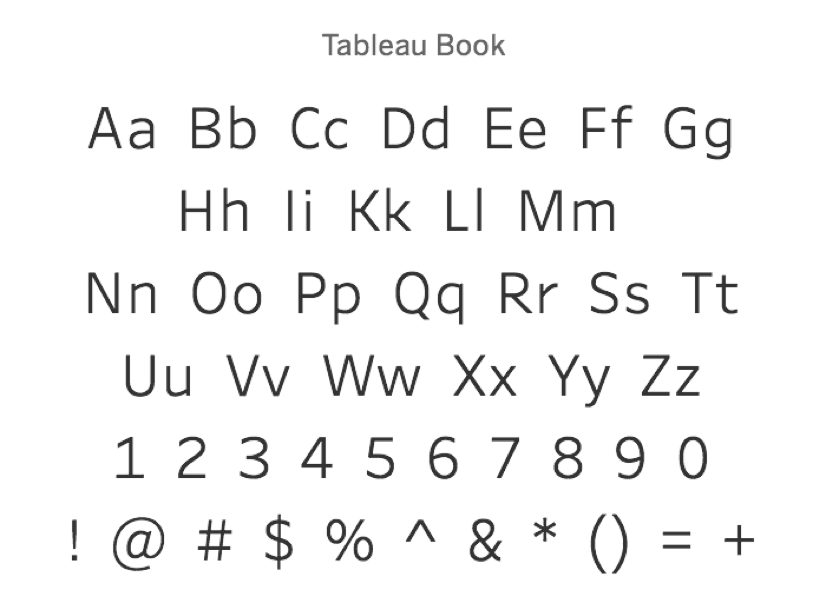
– It includes a new special typography to facilitate compression of data visualizations. Its creator is the well-known Tobias Frere-Jones, a designer who already has more than 700 types to his name.
– Boards for these devices: with Tableau 10 users can share their workbook by choosing the type of display depending on the device in which they want to do it: mobile phones, tablets or desktop.
– Creating custom regions: it is now possible to select a specific region with the cursor within a map visualization and then delete the original geographic field to maintain that own selection.

