
Tableau has become one of the most widely used tools among data analysts in both the corporate and business world and among professionals who use it for editorial purposes. The Seattle-based company currently occupies a privileged place in the market: in the yearly ranking compiled by Gartner it appears among the Business Intelligence leaders.
The most important new features of the latest upgrade, version 9.0., include:
More possibilities for data analysis
The team at Tableau has set out to improve the tool's data analysis capacity, and so the version includes a number of changes:
– New analysis tab: in Tableau 9, users have an analysis tab in which they can drag and drop data calculations on the workbooks from trendlines to calculated averages based on the initial statistical information.
– Rapid customization of the analysis: Now you can modify the variables used in the display directly in the fields.
– Increased accuracy in the analysis: With a simple function consisting of marking with the mouse, you can select data directly in the displays and specify how to modify the trendlines, references or calculations of an average automatically for that selection.
– New calculation editor dialog box: Tableau 9 has a dialog box where users can simply enter calculated fields and see how these calculations affect the display in real-time.
Simple and rapid data preparation
Any professional who has worked with Business Intelligence tools is very well aware that the preparation of data is the prior step for its use. And refining that information in an Excel file –to give a common example– can sometimes be a real headache.
Tableau has introduced improvements in its version 9.0. to make it easier to prepare these data:
1. Data interpreter.
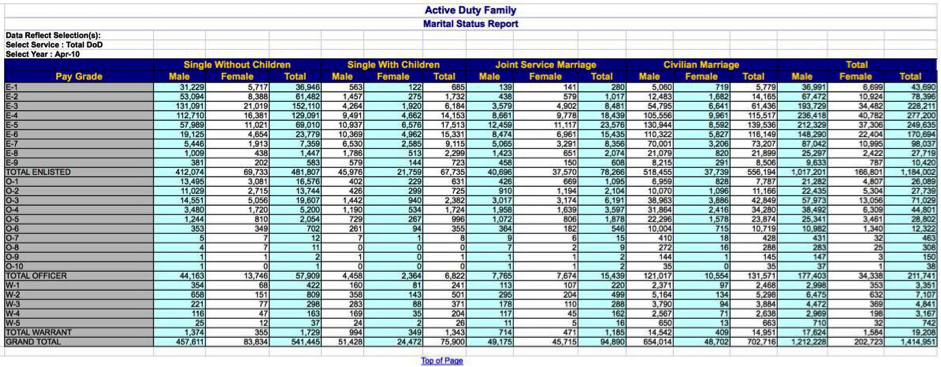
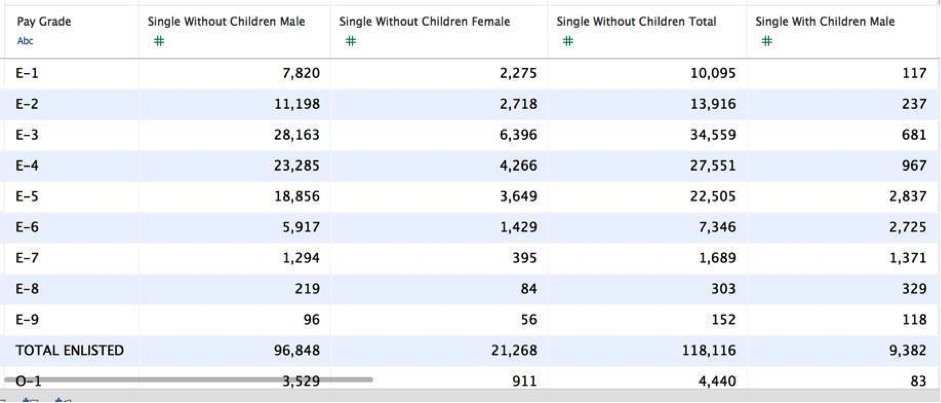
Many times data files do not begin in cell A1 and the headings are compounds. The data interpreter in version 9.0. allows the data to be read correctly wherever they are, even when they're not in order, and accurately separate the headings of the different columns.
Two images showing a practical example. The first shows an Excel sheet with data starting in the first cell, and we also have compound headings. The second image shows how when we enter the data in Tableau, the formatting of the rows and columns with the different data is totally cleared for its use.
2. Dynamic tables.
One of the first conditions you have to learn about Tableau is that the data must have a particular structure before you can start to make displays. Basically, time information.
In many of a company's data files, the date element tends to appear as a heading in one of the columns, when Tableau needs that time-related information to occupy its own space in an Excel column. Tableau 9 enables users to select columns then choose an option entitled ‘Dynamic table’ and correctly place the time information.
3. Split function.
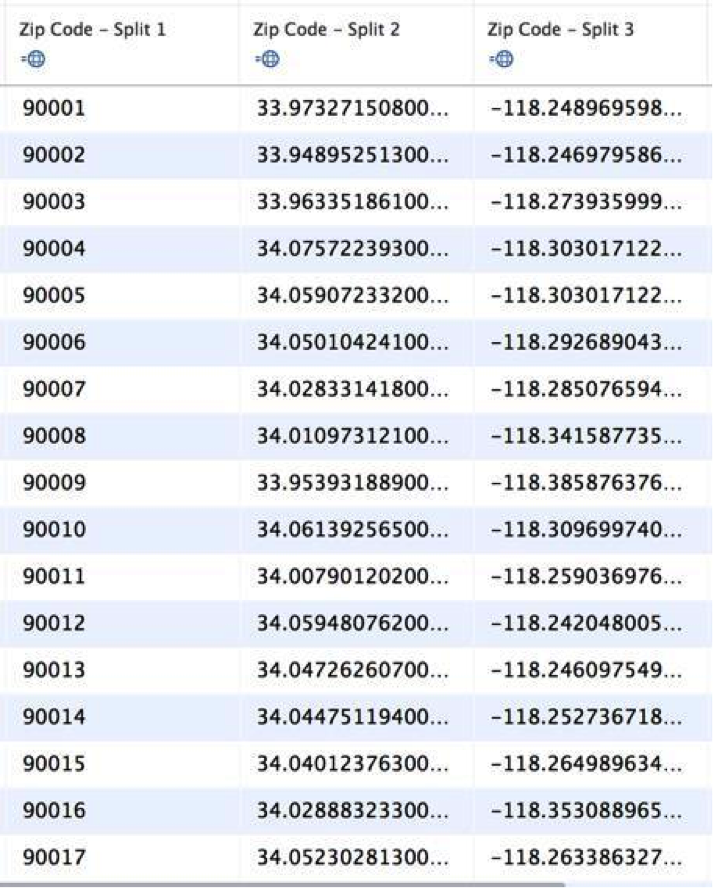
This functionality offers significant advantages. It enables elements in the same column to be separated into several columns. Geographic information like zip codes, latitude and longitude tend to be housed together in the same cell. Tableau 9 contains an option called ‘Split’ that separates all these data into different columns.
Improvements in query performance
According to Tableau Software, the performance of queries in version 9.0. multiplies the features of the previous version by a factor of ten, with 173 million rows of data. This optimization includes new functions:
– An important element in this increased performance is how to make the most of the source databases that Tableau can connect with. Tableau 9 has a new feature called ‘Parallel queries’ for its Tableau Desktop and Tableau Server versions. This parallel query option increases the speed up to nine times.
– Tableau 9 also incorporates the ‘Query blender’. This functionality allows the tool to simplify database queries in real-time by grouping them together to allow the same result more quickly. Here Tableau claims that its data query performance multiplies the speed of Amazon Redshift by two.
– The new version has external query caching storage, that is, it stores the memory cache in the user's workbook. This considerably shortens data loading times. This option is available both in Tableau Desktop and Tableau Server.
Seeing beyond data (level of detail expressions)
This is one of the standout new features of Tableau 9. The expressions of level of detail (LOD expressions) are the new tool in the calculated fields of this Business Intelligence tool. These expressions add greater levels of analysis and value than can be obtained from a standard display.
These expressions apply precise calculations to a specific dimension. Each user can see beyond what is shown by the data alone. On the Tableau page, there are several interesting examples to explain it (with tutorials and displays showing calculations of the KPI for daily profit, customer seniority, comparison by sales or targets and more).
The LOD expressions ultimately enable the users to extract value from where there appears to be none. This is a practical example used by Tableau as a tutorial:
KPI for daily profit:
Tableau 9 improves the maps… but not much
The maps were the big black mark for Tableau and, in spite of the improvements, this may still be the case. In any case, this version 9.0. has new features:
1. New selection controls.
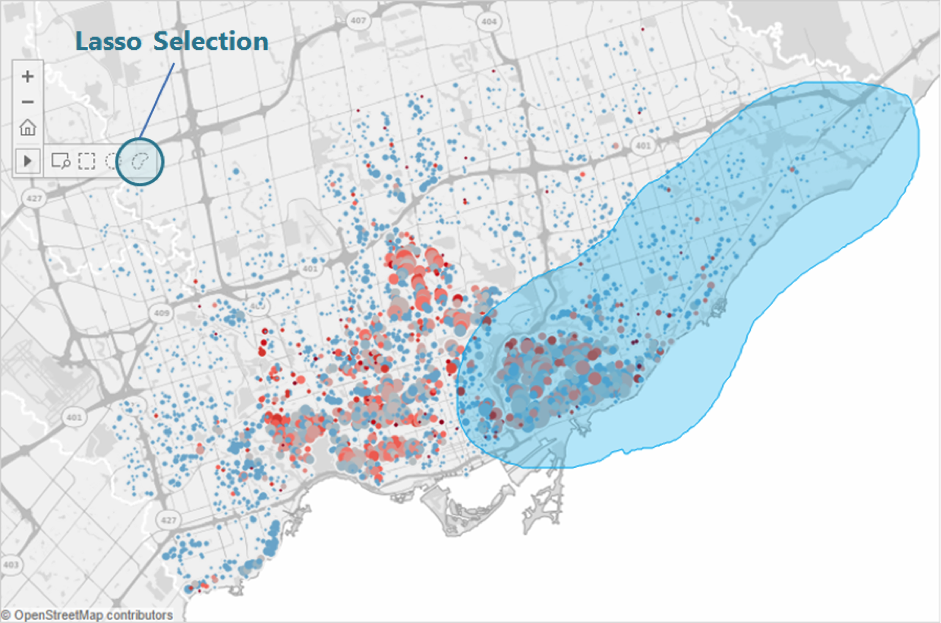
While earlier versions had a rectangular selection control, this version 9.0. adds another two types: radial and lasso. These can be used to capture marked points on a map that are hard to access. What's more, Tableau 9 includes keyboard shortcuts for handling these controls: Alt+A for the rectangular control, Alt+S for the radial control and Alt+D for the lasso control.
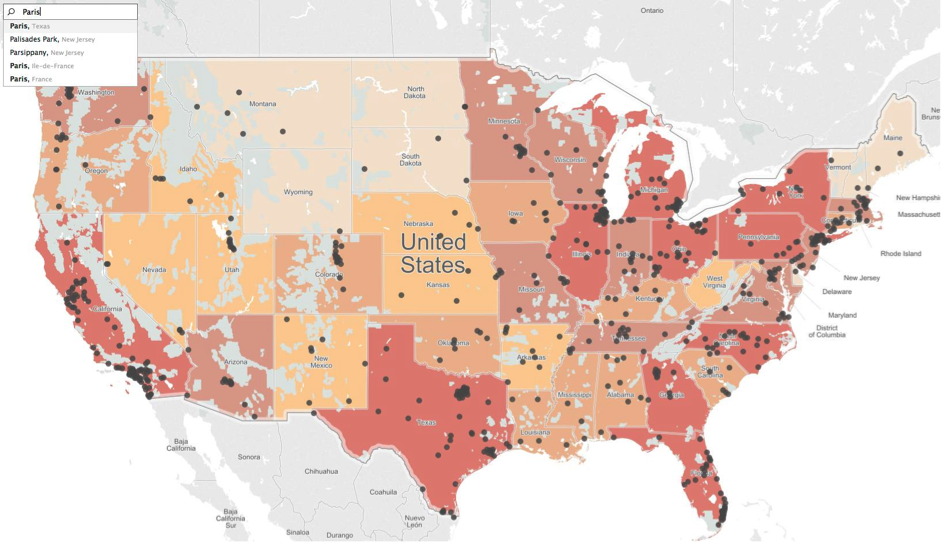
2. Geographic search.
Tableau 9 features a predictive search engine for working with its maps. This is an interesting option if you want to look for an exact location quickly.
3. New geocoding data.
The new automatic geocoding includes new parts of the world:
– Departments in Argentina.
– Zip codes and local government areas in Australia.
– Districts in Belgium.
– Municipalities in Brazil.
– Provinces in Chile.
– Prefectures, counties and districts in China.
– Districts in Germany.
– Provinces and metropolitan cities in Italy.
– District municipalities in South Africa.
– Zip codes (ZIP) and county updates, FIPS code values for geocoding of counties in United States.
– Special municipalities, cities and counties in Taiwan.
Follow us on @BBVAAPIMarket


